- YouTube
Grizz Facts
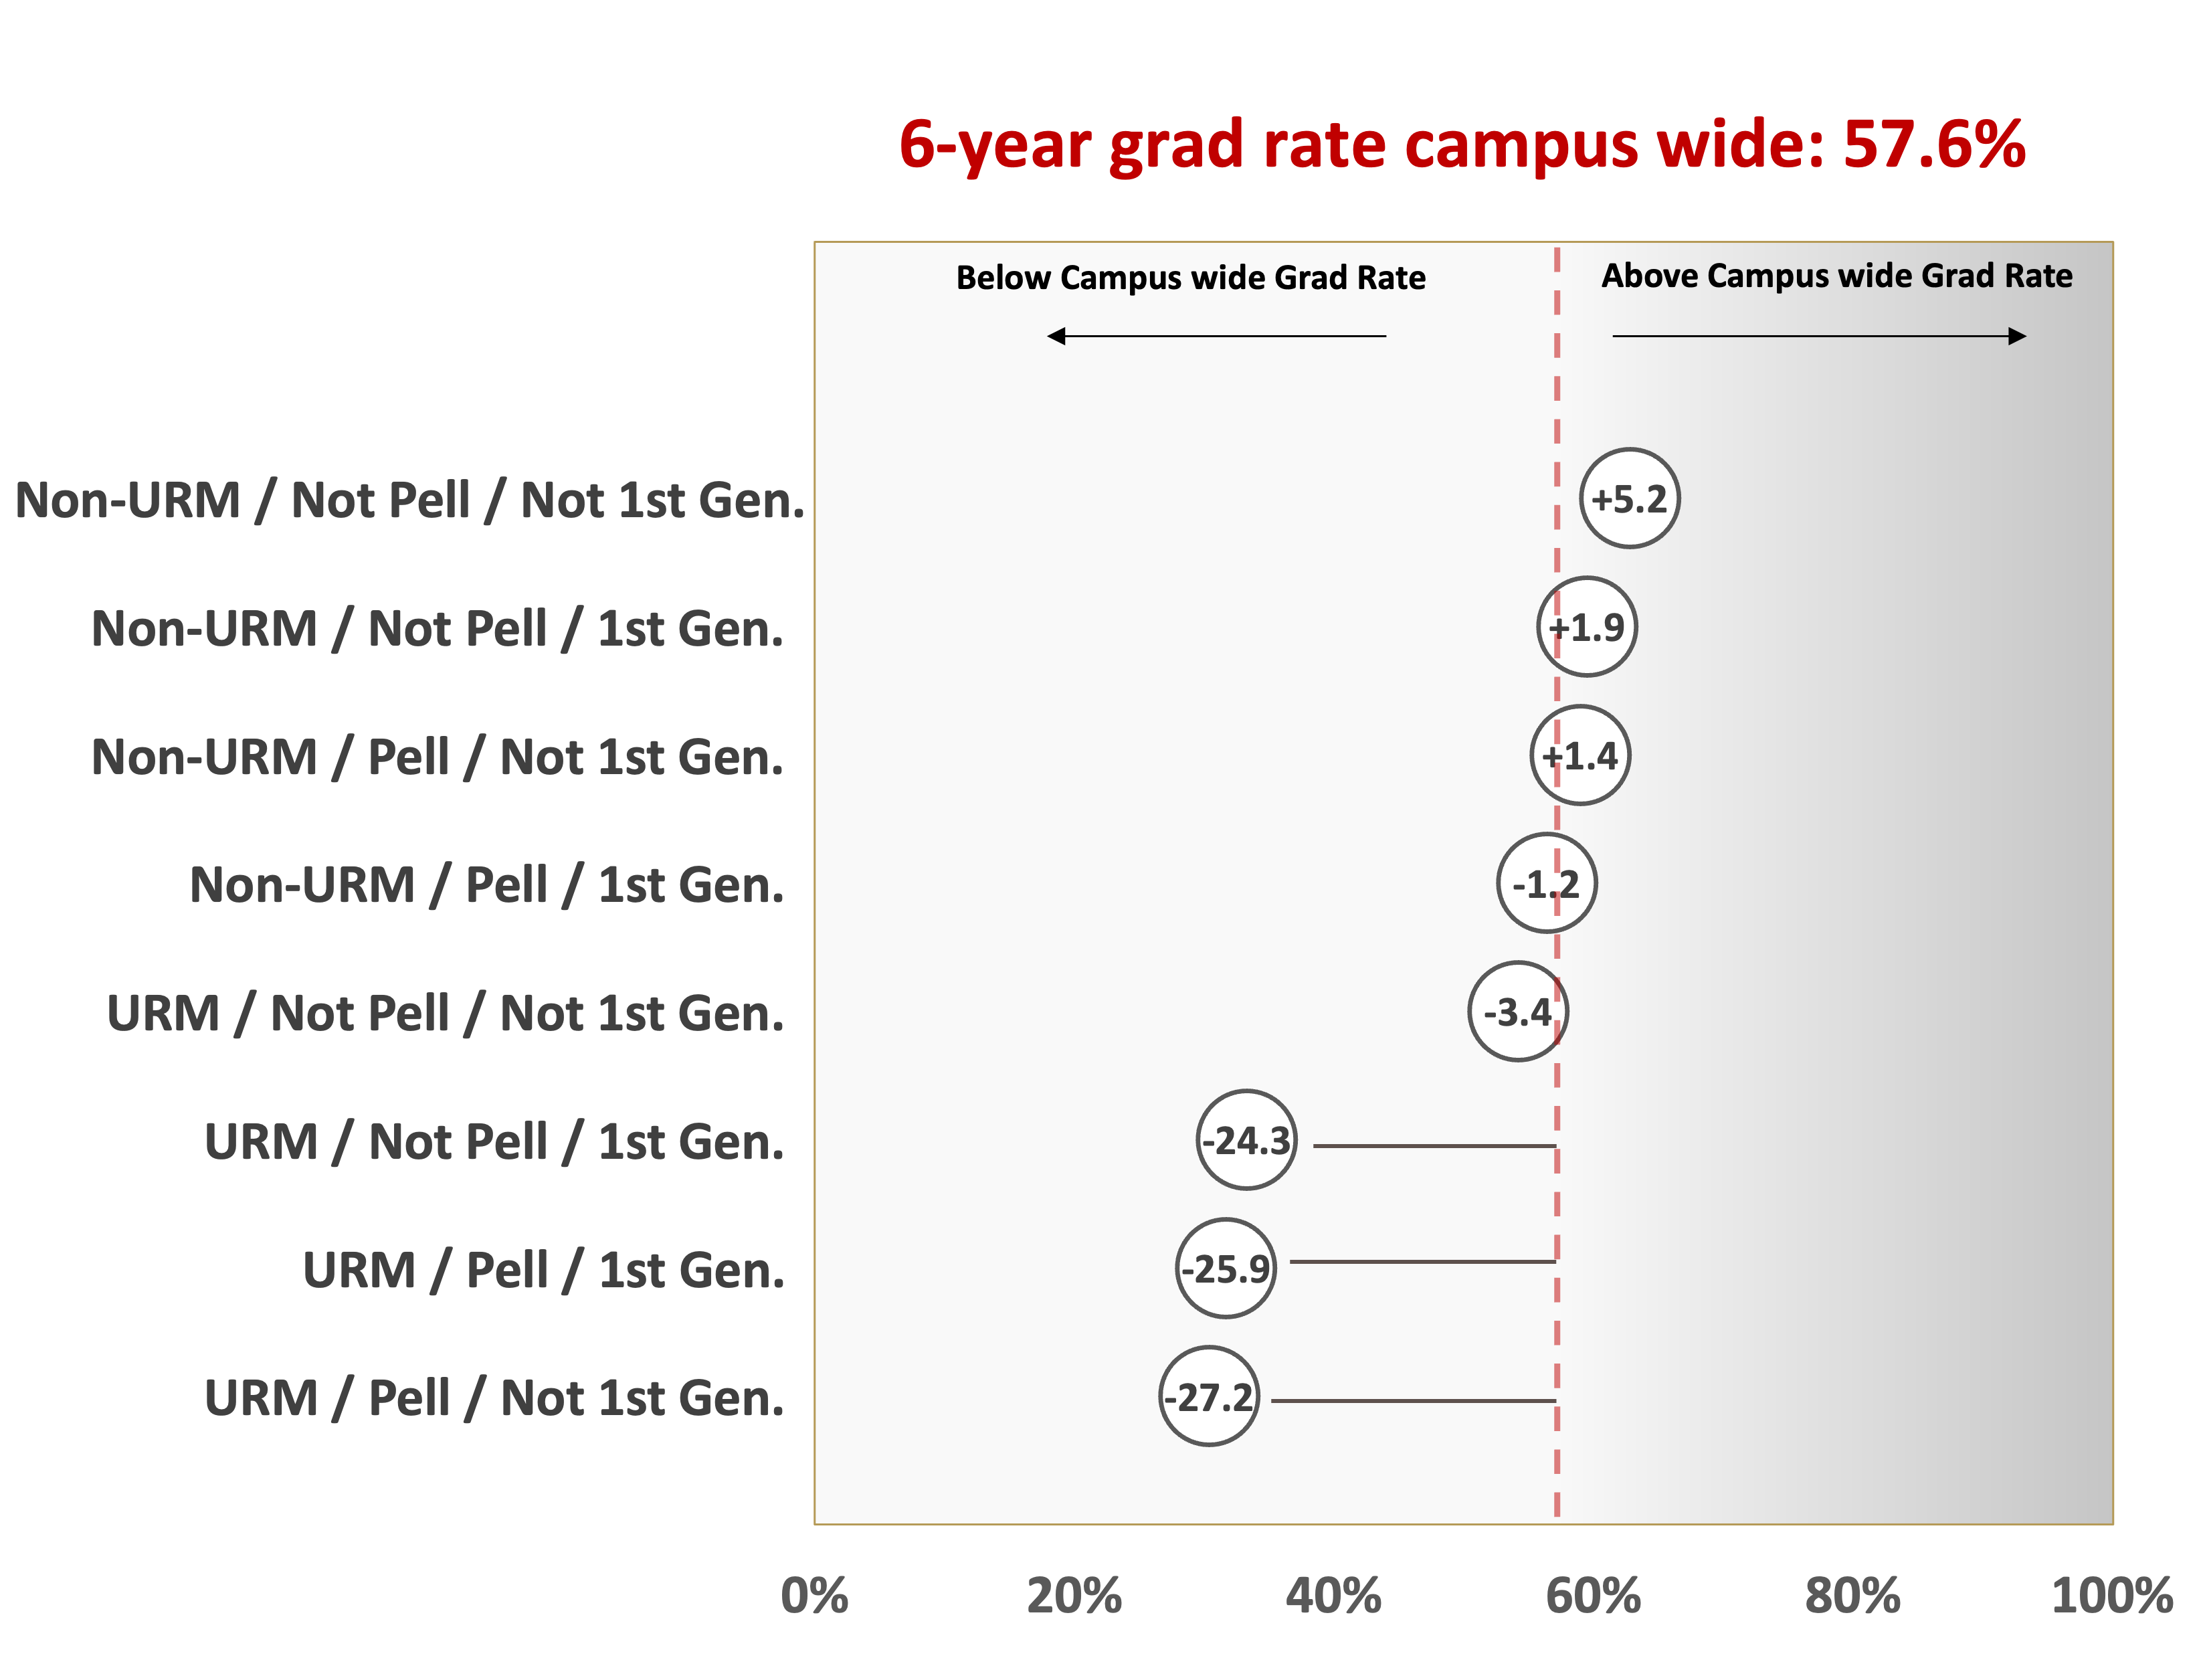
OU six-year graduation rate by student sub-groups
OU's Student Success and Equity Dashboard explores six-year graduation rates by race/ethnicity, economic status, and family educational background

The six-year graduation rate for all full-time first year students who started OU in 2016 was 57.6%. However, the outcomes for students vary by racial/ethnic background, economic status, and family educational background. The chart shows the six-year graduation rate gap for groups of students relative to the campus-wide rate. The Student Success and Equity Dashboard features interactive data tools to explore OU’s equity gaps and to understand how these gaps impact the success of our students.

 December 5, 2022